Introduction
One of the first things high school students think about is what college to attend. Some of the questions high school students ask are:
- Are my grades good enough to get into an Ivy League school?
- Is it even worth going to an Ivy League School?
- Should I get decent enough grades and just go for a good college in my state?
- Is there really a big difference in students salaries that graduate from a Ivy League school compared to any other school?
This blog post answers these questions high school students have thought about. I will be analyzing and visualizing this dataset to compare the Ivy League salaries throughout a graduates career compared to other colleges in the United States. Before analysing the data, I believe that there will not be a significant difference in Ivy League salaries compared to other colleges in the United States. This blog does not take in account what career pathway a student would want to pursue. This blog only looks at the average monetary earning from individuals that graduated from a college.
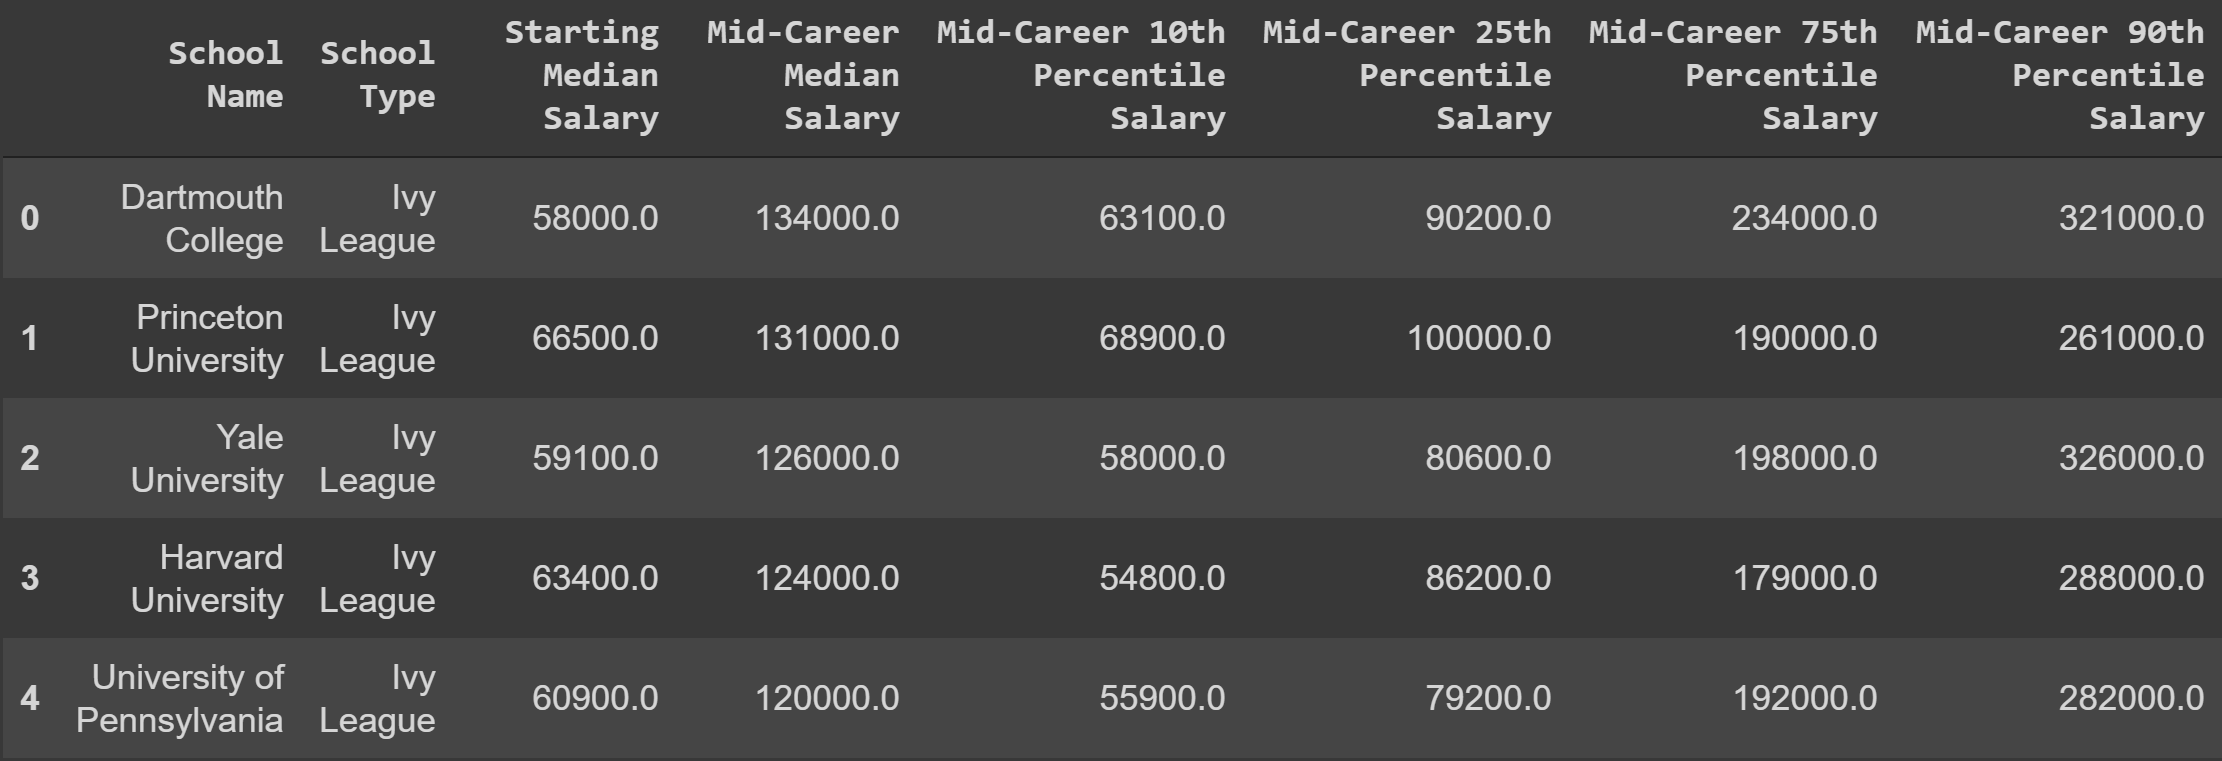
The image above shows the raw dataset I will be working with. This dataset consists of 269 schools all across the United States. Each school is categorized into five categories: Ivy League, engineering, liberal arts, party (I’m not really sure how a school is considered a “party college”), and state. Each school contains the average mean salary throughout a graduates career (starting salary to mid-career 90 percentile).
Ivy League Salaries vs. other colleges Salaries
The first thing I want to do is to compare the mean average salary for each salary category from each school type. I split the dataset into five different subsets that only have the data for each category of schools so I could find the mean of each salary category. I then created a grouped bar chart to visualize the mean for each salary category from each school type.
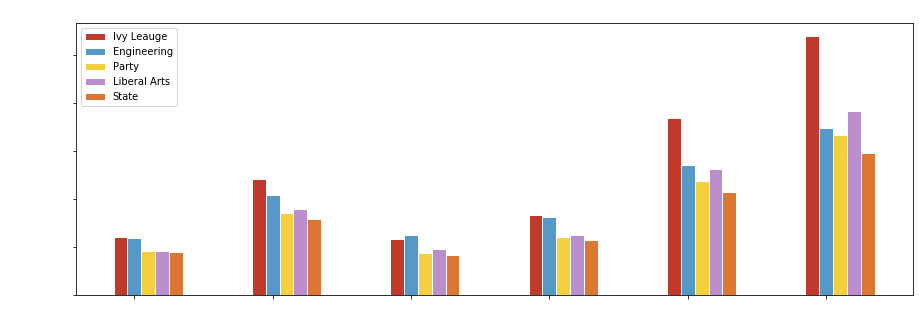
The x-axis is each salary category and the percentages are the percentile of mid-career salaries (ex: 10% means the salary mean is higher than 10% of mid-career salaries but lower than 90% of salaries). By looking at the graph, you can tell that Ivy League schools have the highest mean salary for five out of six of the salary categories. Engineering colleges are very close to Ivy League colleges from starting mean salary to mid-career 25 percentile then Ivy League schools shoot up in salary afterwards.
We can analyze how close the means between Ivy League and Engineering are by plotting the two categories in their own graphs.
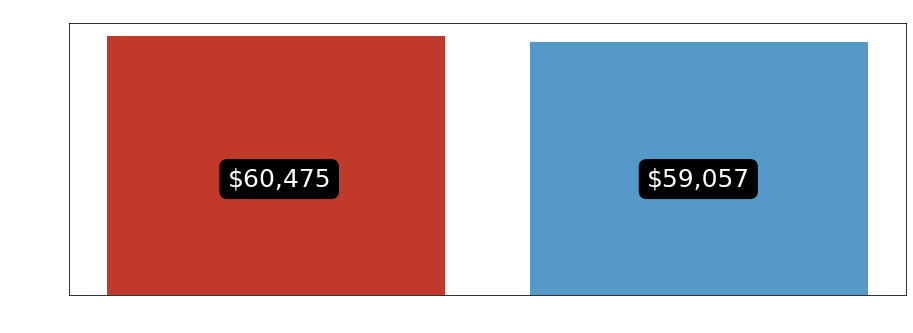
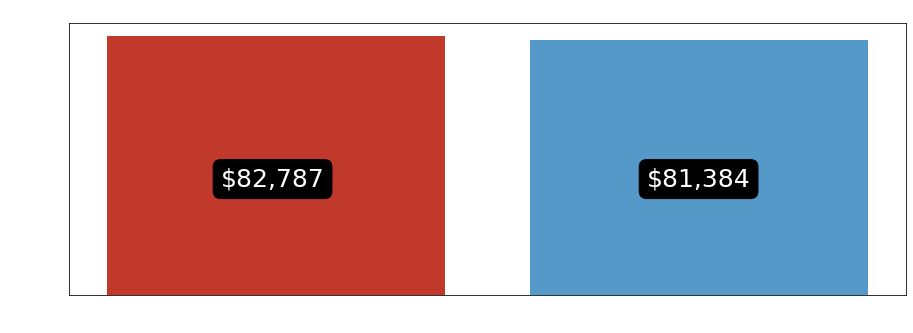
With the graphs above, we can further prove that the Ivy League mean salaries is slightly higher by an insignificant amount compared to engineering colleges.
Ivy League Salaries vs. Engineering and Liberal Arts Salaries Combined
To further prove the significant difference in Ivy League School salaries, We can compare Ivy League salaries to Engineering and Liberal Arts salaries. To do this, we can get the second and third highest mean salaries in the data and get the mean of the two and compare it to the Ivy League Salaries. Once we get the means, we can plot it on a graph.
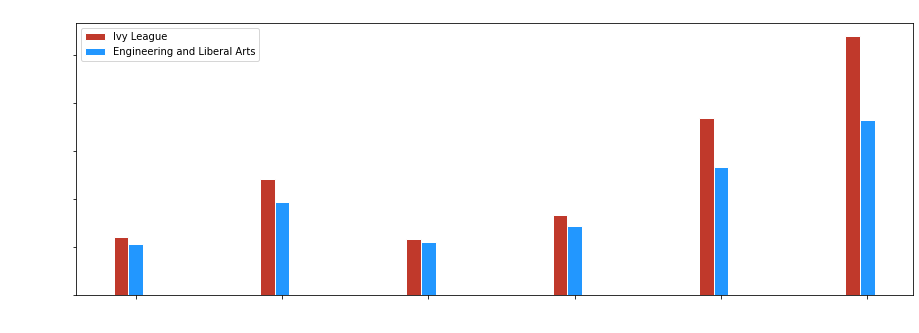
Even with combining two high mean salaries, Ivy League schools still come out on top. If we calculate the pecentage difference for the 75th percentile and 90% percentile of salaries, we can see how significant the difference are. Ivy League 75th percentile 32% difference in salary and Ivy League 90th percentile has a 38% difference in salary when compared to Engineering colleges and Liberal Arts Colleges salaries combined.
Conclusion
By the data we analyzed, there is not enough evidence here to support my hypothesis. Just by looking at the data, there is a significant difference in Ivy League salaries compared to other colleges in the United States. The outcome of this data could change if we take account of what career pathway a graduate wants to pursue. In conclusion, if you have excellent grades and have perfect SAT/ACT scores then choosing an Ivy League college is not a bad choice to pick